

#google #ga4 #analytics
GA4: How it works and… where to find “missing reports”?
On July 1, 2023, we bid farewell to the old, tired Universal Analytics, to finally move to the new, shiny GA 4 and enter a new era of data analysis. At least that’s how it looks in the announcements, which every Google Analytics user has encountered over the past few months. In some Universal Analytics, data collection has really ended. But is GA4 really so beautiful and simple or rather is the new tool like a raw building, to which users are invited with a whole set of their polished reports from the previous Analytics? In this article, we’ll take a look at what awaits us in GA4, what we can’t (yet) expect, and where to find favorite reports. The additional attraction is the change in the interface and their names. Let’s go!
What’s new in GA4
The easiest thing to say is that everything is new. For those entering GA4 for the first time, it’s not easy to find themselves right away. And the longer they worked with Universal Analytics, the harder it is to switch to new tracks. Meanwhile, the new method of measuring data, appearance, and configuration of some already known settings have changed.
GA4 measurement method in Google Analytics 4
Let’s start with the measurement method. Google has abandoned hits and sessions in favor of a single event system that reflects all interactions with the site. So an event is not just a click or scroll, but also the start of a session (session_start) or page view (page_view).
1. Standardization of measurement
Standardization of measurement is a result of a need of measuring data from the site and applications in one Analytics service. This is an important step that Google takes to catch up with actual consumer behavior. Years ago, we sat down at the computer once a day to browse sites, decide on a purchase, and immediately complete it. Now we watch a post on Insta on a phone, browse the offer on a desktop at work, and decide to buy on a home computer. Thanks to collecting data in one GA service, we no longer need to collect pieces of data from the site and apps to manually glue them together later. Now you can view and analyze these data in in one tool. Tracking configuration takes place in separate data streams: one for the website, the iOS app, and the Android app.
2. Exploration
Another great feature is the Explorations, which can best be likened to a scratch pad where you check and calculate working details needed for further actions. GA4 provides us with six methods of data exploration. These are:
- Free exploration, which is in the form of a table with the possibility of inserting several dimensions and several types of data at the same time. Krista Seiden, co-creator of Google Analytics, calls it a “table on steroids” 😉
- Funnel exploration, well known to us from the purchase funnel report in Universal Analytics. Now you can choose any path steps that you want to check on the website/application, to know if users went through it.
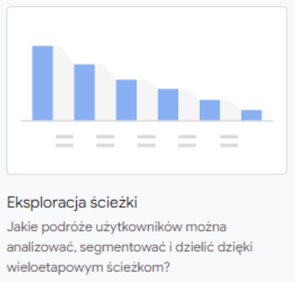
- Path exploration, in other words: flow. In this case, you can choose either the starting point or the end of the journey.
- Segment overlap, which can be very useful for finding interesting audience groups.
- User exploration, which helps determine the value that users bring over the entire period of activity on the website/application.
- Cohort exploration, also used to check the behavior models of returning users.
You can freely select dimensions, data, create segments and apply filters in them, which is a big plus of GA4. However, there are also imperfections. Among them are two significant ones: the lack of the ability to reuse created segments in other exploration and the view_only mode of sharing of exploration. We expect improvements in these areas, as the entire analytics community raises the issue of these and other inconveniences. Everything can be circumvented with additional manual work, but it was supposed to be automatic and convenient 😉
GA4 Interface.
However, editing and co-creating GA4 is one of the better features of this program. The idea of the new Analytics was simple: the user receives a simple, intuitive interface with a small set of predefined reports and a set of tools to add all the others that they need. Looking at it step by step: the interface is indeed more friendly than in Universal Analytics, which I regularly see from the reactions of customers encountering Google Analytics for the first time. In the case of GUA, people were overwhelmed by the number of reports and the lack of information about what they are for. In GA4, they see fewer reports, and next to their names are short explanations or questions leading to how to read the data. In addition, on the main page, there is also a bar with “recently viewed” reports or options in the service, which can be conveniently used as navigation shortcuts.
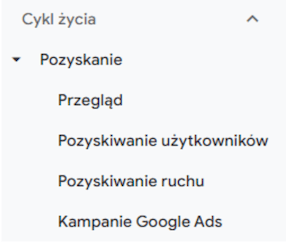
The set of basic reports varies slightly depending on the data streams and the measurement profile declared during the service creation. However, it can still be further modified by editing individual reports and adding and removing them from the collections that are part of the navigation. For example, the Google Ads Campaigns report, which is located on the aggregate User Acquisition page, is worth moving to the Acquisition section as a separate report.
Each newly created report goes to the Library (Reports > Library), where you can find, edit, add it to a collection, share or delete it. The whole concept of a report library and collections, which allow you customizing the report menu, is a very good idea and makes Google Analytics reach a level where we can finally tailor the service to our own needs. That’s a big plus.
And finally, the GA4 interface is responsive, so you don’t have to scroll each time to see the full report card. At least not always 😉
GA4 Configuration
1. Advanced Measurement
GA4 configuration has also brought us several new solutions. Among them is the collection of data as part of the so-called ‘advanced measurement’. This means that some interactions, which had to be configured manually in GUA, here we get ready, although they need to be refined a bit to have relatively complete data.
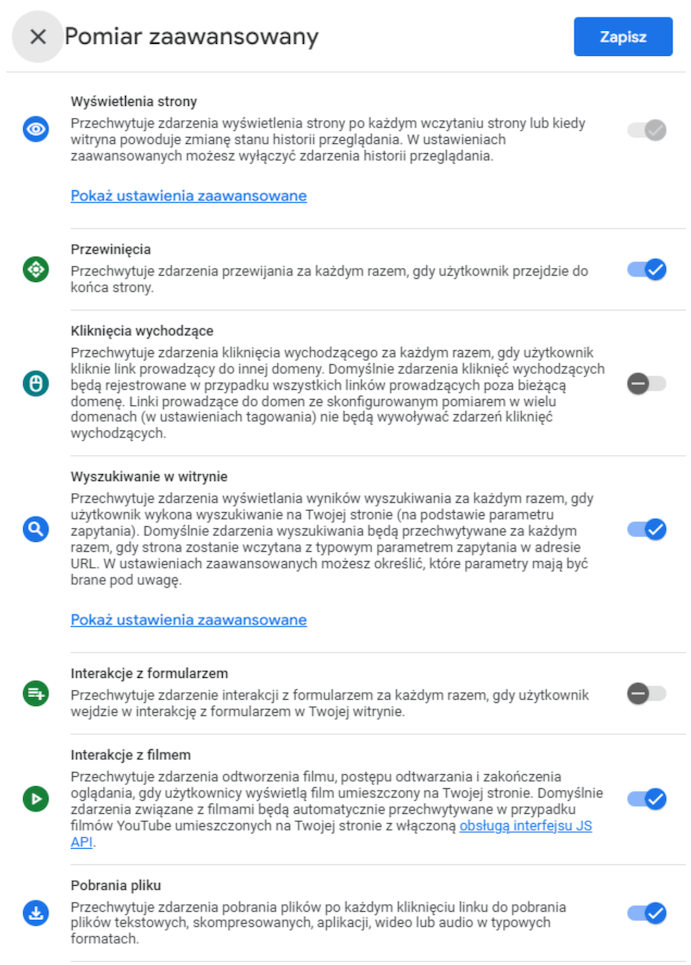
You can also disable them, which is quite practical. At the moment, for example, it is recommended not to track interactions with forms, as they register in a somewhat random manner. Also, when we send our own events measuring the same thing (e.g., file download), but with additional parameters, the corresponding event from the additional dimension should be disabled to avoid data duplication.
Within the framework of advanced measurement, the following events and parameters are collected:
- page views (page_view) – with the titles of the displayed pages, but without their URL addresses,
- scrolls (scroll) – they only count the page scroll at 90%, there are no other thresholds
- outbound clicks (click) – they do not contain any information about which link was clicked, so the condition that the outbound link is one whose URL does not contain the site’s domain also meets any phone number,
- site search (view_search_results) – it is very useful for all sites with a search function, such as stores or blogs, but unfortunately it does not convey the content of the search terms (tip: it collects these terms, and below is described how to introduce them into reports),
- form interactions (form_start, form_submit) – they register in reports at random moments, because on sites the HTML
- video interactions (video_start, video_progress, video_complete) – they only concern YouTube videos embedded in the site and do not pass any parameters allowing these videos to be distinguished,
- file download (file_download) – it does not contain parameters allowing the downloaded file to be identified.
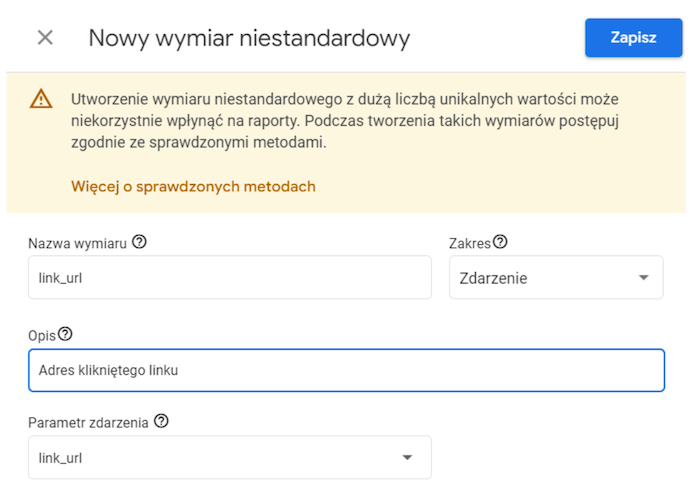
So there’s something, but not quite. The most interesting thing is that these additional parameters are partially transmitted along with the events of advanced measurement, but in default reports, they are not visible. To see them, you have to register custom parameters (Administration > Service > Custom Definitions). Here is a list of basic parameters for individual events:
- page views (page_view): page_location, that is the URL of the displayed page,
- scrolling: percent_scrolled (although in the case of automatically collected scroll it will always be “90”),
- outgoing clicks: link_url, which is the address of the clicked link and link_text, which is the text of the clicked link, which will allow to make sure which of the clicks are links to social media and which are clicks on a phone number on the website,
- site search: search_term, that is the content of the phrase searched on the site,
- form interactions: there is no hope here, it is recommended (even by people from Google) to disable this event,
- video interactions – video_title, video_url, video_status, which are parameters allowing to identify displayed videos,
- file download – link_url and link_text, which will distinguish downloaded files by their addresses and names on download buttons.
2. Events in GA4
The capabilities for configuring events have been greatly expanded. Apart from the fact that they can be implemented in the website code or via GTM (recommended), there is a possibility of creating new and modifying existing events within GA4 itself. Creation consists of configuring a new event based on another one, already collected, by adding a condition. For example, based on a page_view, to which we add a condition that page_location (URL) contains /contact, we can create a contact page view event and call it, for instance, page_view_contact. Modification, on the other hand, comes in handy for changing event names sent automatically by plugins such as chatbots to ones that are clear for us.
Events now follow different rules than in Universal Analytics and this is a topic for a separate article. It’s hard for it to be otherwise, if they are now responsible for all measurement – from page views, through session counting, interactions with the site/app, to ecommerce. In short, however, there are no longer categories, actions, labels, and values, because you can add any parameters you want. Moreover, according to Google’s recommendation, the naming should use lowercase letters with underscores instead of spaces (i.e. snake_case). I do not recommend using numbers, as they may block the use of the event in other GA4 functions (e.g. Audiences).
It’s worth considering the structure of event measurement, take advantage of the opportunities that GA4 provides, and act as follows:
- individual elements such as clicking on a phone number (click_phone) or clicking on an email (click_email) should be named according to Google’s recommendations (Google documentation: https://support.google.com/analytics/answer/9267735?hl=en&sjid=13742411819859165880-EU)
- repetitive elements, like submitted forms should be measured as one event (form_submit) containing additional identifying parameters, e.g. form_name with the value “contact”, or “product_request”, shop_category “b2b”, or “b2c”,
- add to each event such parameters that best define it for data analysis, e.g. link_url for link clicks or link_text for button clicks.
Tip: During testing in Debug View, it’s worth seeing which parameters are sent automatically and not to duplicate them in custom parameters (e.g. page_location). However, you still need to register all of them.
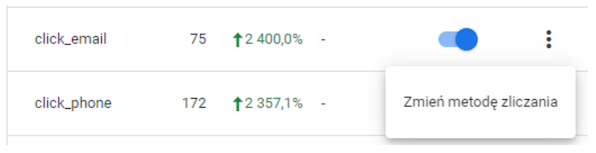
3. GA4 Conversions
A pleasant change in the configuration is the creation of conversions using the ‘enable-disable’ slider 😉 We simply mark only the events we consider as conversions, and they appear in the appropriate report. Just like in Universal Analytics, data are collected from the moment of enabling conversions. You can, however, independently determine the counting method; one per session or one per event.
4. Other changes in Analytics 4 configuration
Another convenience is the configuration of tracking across multiple domains, which finally does not require additional changes in the code or in the tag in GTM. In GA4, you just need to add the names of the domains whose traffic is to be measured together. (Administration > Property > Data Streams > Configure your Google tag settings > Configure your domains)
There are also minor improvements that we not only don’t need to configure anymore, but even remember them. One of them is automatic IP anonymization, and the other is automatic filtering of known bots traffic.
However, not everything is enjoyable. Google in the new tool loads data according to the official documentation, so we find them in the reports only the next day. This causes a lot of trouble to everyone who got used to seeing e-commerce transactions after fifteen minutes. However, the date range of reporting includes the “Today” option, so we hope this will be changed. It would be useful for quick sales actions, right? Maybe they will manage to implement it before the Black Week.
5. Testing
Testing is not anymore in the Real-time report. GA4 offers Debug View, which registers all events sent from GTM in preview mode or while testing the site with the Google Analytics Debugger plugin. Initially, there were significant delays in data reading, but now it’s much better. And this is, after all, the general trend in GA4. It is evident that Google developers still work hard to improve individual functionalities and add new ones.
6. Linking Accounts
In addition to simplifying the use of Google Analytics, this tool has another purpose: efficient functioning within the Google ecosystem. Hence the easy connections with other accounts. The most commonly used Google Ads and Google Search Console are surely familiar to you, but now the basic version also includes Merchant Center and BigQuery. The latter tool may be key for storing full historical data, as Google, in optimizing data management, has deleted the option of storing full data from the beginning of the service and replaced it with 2 or 14 months (in GA4 360 – up to 50 months). Here’s a note: the default setting is to store data for 2 months, so it’s one of the things that need to be changed while configuring the new GA4. After this period, only aggregated traffic information will remain, but without details about its sources or users.
It has also become mandatory to activate Google Signals for all those who connect GA4 with Google Ads. Preparing for a “cookie-less world”, Google checks part of the data using Signals, and without this, it does not transfer data between Analytics and Ads.
What is (for now) missing in GA4?
As I mentioned earlier, new users of Google Analytics feel quite well in GA4. It’s hardest for us to adapt, those who have spent years with Universal Analytics. After all, we have our favourite paths through reports, settings we make in the new service almost automatically, filters that help in data organization, and suddenly some of these options are not there at all and it is unknown whether they will be.
What is (for now) not there, but there is hope that it will appear?
First and foremost, advanced filters. Currently, you can only exclude traffic and only based on IP or a cookie.
There is no possibility of configuring content grouping directly in GA4. The only option currently available is to send the content_group parameter from the outside.
Calculated metrics also do not have their place for now and so far Google does not mention this.
A small element that greatly facilitated life, i.e. Annotations, has not yet found its place in GA4. However, there are already extensions for Chrome that try to fill this gap. Nature abhors a vacuum 😉
What we probably shouldn’t expect in Google Analytics 4
We said goodbye to views in Google Analytics forever. The matter was clearly stated: the largest companies, which have purchased GA4 360 and Views are necessary for them, have subproperties at their disposal. Less complex websites are advised to either create separate properties for e.g. local domains of the company in different countries (shoponline.pl, shoponline.de etc.) or set permanent filters in reports, which allows the creation of several sets of reports, separate for each e.g. language version of the website/application. This requires more configuration at the beginning, but it is achievable 😊
There is also no word that the Navigation Summary option will appear, so it’s worth looking for your own way of checking data related to the flow through a specific page. In this case, exploring a fragment of the path can be helpful.
The list of “missing” functionalities is long and certainly slightly different for each of us. However, for most options there is a chance that they will still appear in GA4. Work is in progress.
Where to find the “missing” reports in GA4?
And finally, a tough topic, namely, how to now analyze data and where are our favorite reports, which we reached in Universal Analytics with our eyes closed?
First of all, take a deep breath and look at the new menu. We will still find it on the left side, although the similarities with Universal Analytics end here.
There are two levels of menus: The main one, containing sections Home, Reports, Explore and Advertising and the second one containing collections, i.e. sets of reports. And here’s the first surprise: not all of them are in the Reports section, because data on conversion paths and attribution can be found in Advertising.
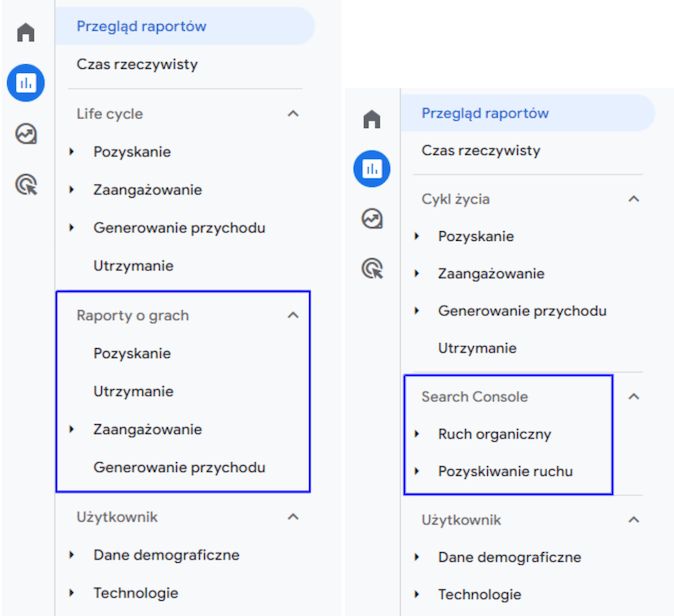
Basic reports are divided into two collections: Life Cycle and User.
In the first, we will find data related to interactions with the site:
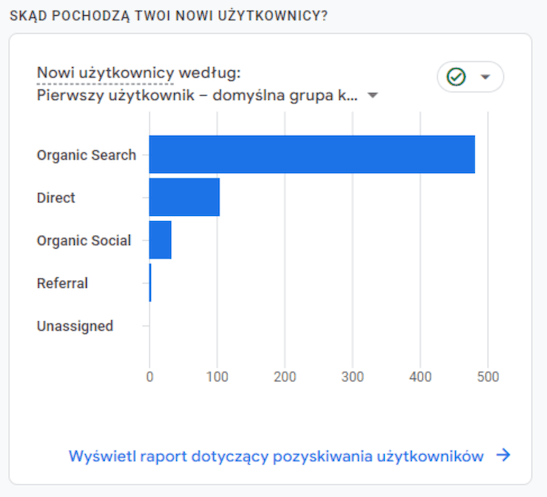
- Acquisition – divided into traffic, i.e., the source assigned to each session separately, and users, all of whose visits are attributed to the source of their first session. This is an improved version of the source / medium report from GUA.
- Engagement – i.e. user interactions with pages: events, conversions, pages and screens, and landing pages. This is a compressed version of the Behavior section from GUA, with conversion reports added from the old Goals part.
- Monetization – divided into e-commerce reports, in-app purchases, publisher ads and others. This is a continuation of conversion reports – those related to sales.
- Retention. This is a cohort analysis report, which was located in the Audience section in GUA. Now, thematically, it has been assigned to the Life Cycle collection.
The User collection will show data related to users themselves, divided into Demographics data and Technology. Now, under the heading “Demographics” are all dimensions, i.e., location, language, age, gender, and interests. Similarly, in technologies, there is data on all technical parameters, such as browser, device category, platform, app version, etc.
Search Console reports are unique, as they appear in the Library only after linking accounts. They is a separate collection that needs to be published to enter navigation.
By the way, the Default channel group have been refreshed and organized. A few new ones have been added, for example, Social and Video are divided into organic and paid. It is worth taking a look at the new definitions to properly align with your UTMs. (Google Documentation: https://support.google.com/analytics/answer/9756891?hl=en)
Among the reports and features, a lot is changing. This spring, promotions reports, customer path to purchase appeared in the shopping section, a few weeks later the ability to create custom channel definitions. One of the constant things in GA4 is its change. Don’t be surprised when one day you will have an option in one place, and another in a different place. Or when a new report suddenly appears. You can compare this stage to installing new devices in a newly built building. Soon we all will be fine with this new place! 😉