#Ads #PerformanceMax
We present the most important reports of the Performance Max campaign and analyze the data
Probably every SEM specialist after activating the first Performance Max campaign asked how to find interesting statistics and data that will allow increasing the effectiveness of activities in the future and provide the opportunity to analyse the effectiveness of the campaign and its management.
Many people are feared by the slogan of “full optimization” and we are very cautious while approaching such campaign at the beginning.
We want to use our experience to show you how the Performance Max campaign works and provide crucial information to help you analyse the effectiveness.
Performance Max – get into the details
There is limited detailed data regarding efectiveness of the new format available at the campaign level, so in this part we’ll share tips regarding the most important reports and data interpretations for Performance Max.
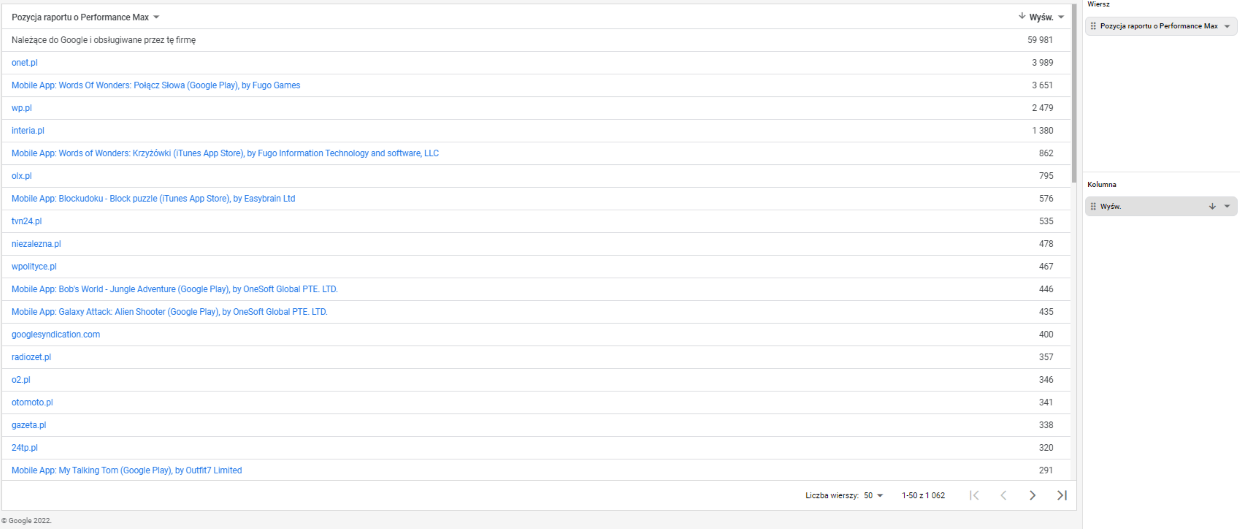
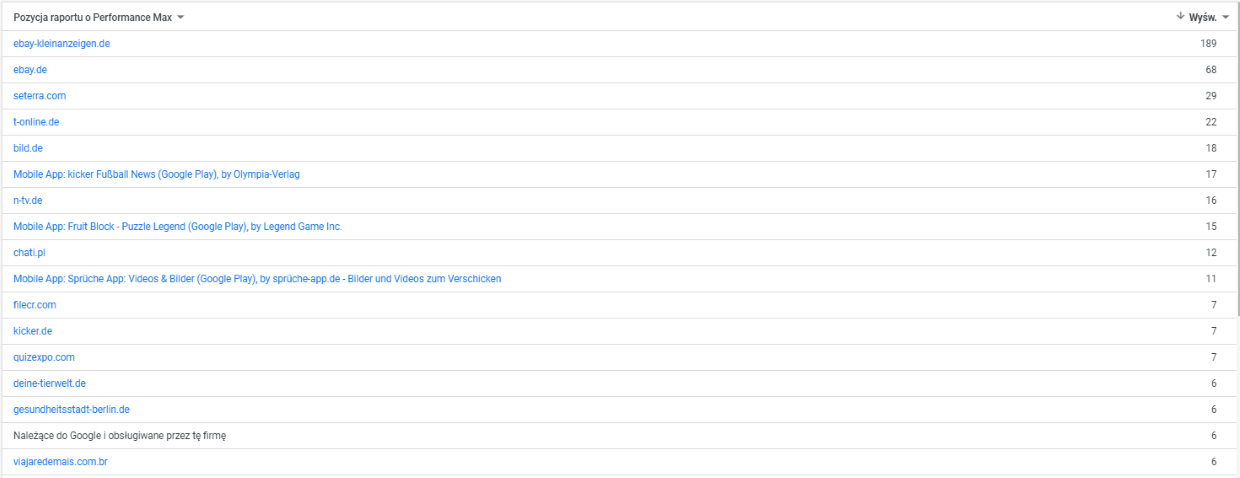
In Raporty -> Wstępnie Zdefiniowane Raporty you can find a rundown of target places of Performance Max campaign.
Unfortunately, we currently do not have the ability to exclude these targets at the campaign level itself, but this data can help us verify where our ads are targeted.
The campaign we’re reporting generated 184,436 views in the last 30 days. Based on the report, we can see that 59,981 of these views concerned target place qualified as a Google Belonging and operated by that company.
Then, go to the Grupy wizytówek tab in the Performance Max campaign. Data shows that all products in this campaign were viewed 124 744 times, generating 1014 clicks at a cost of PLN 545.98. The campaign cost a total of PLN 1304.22, which means that PLN 788.24 in this campaign was used for 793 clicks on the advertising network (including probably clicks in applications), Google Maps and search networks without presenting products. Furthermore, we can notice that the cost per clicking the products was PLN 0.53 and other clicks were generated at a cost of PLN 0.99.
The campaign received almost 70% of product views and 412.17 click-to-product conversions. A total of 451 conversion activities were recorded, so product clicks accounted for 91% of all conversions, but the cost of these clicks is only 32% of the total cost of this campaign.
We can also check the report on ad views on specific devices by analysing the data of the same campaign. Unfortunately, devices with worse results in terms of effectiveness at this point cannot be excluded either.
Here, however, we find a certain correlation in terms of effectiveness between the number of ad impressions on cells and targets – in the target report, we can filter out placements in terms of Type -> mobile application. We can import this report into Google Sheets or Excel and add up ad views in mobiles. In discussed case it’s 13,325. For websites, the result is 18,869.
After data analysis, we can conclude that due to the effectiveness of a large number of views and clicks on advertisements from mobile devices, it could have come from ad impressions in apps and websites, which justifies such low results of conversion values and conversion rate compared to computers.
Performance Max method
Performance Max campaign, somewhat contrary to Google’s recommendations, can be launched without resources – like PLA Smart with signals.
Surprised? So are we 🙂
This tactic is worth using if we want to limit the ad number in ad network or if our industry has a lower effectiveness in the network.
How does it work? We create the campaign with the category of products, but without any resources (it can be saved though!).
Number of product views corresponds to the number of campaign views.
Placement statistics confirm that only a small part of all views included the ad network and mobile apps.
In the report, there is no disproportion between cells and computers, as in the case of the previous campaign with resources.
Campaign established as a part of the test, currently active for 12 days, generated ROAS at the level of almost 382% on products that previously generated virtually no revenue in the smart PLA campaign.
Statistics
Statistics can provide important information about (surprisingly!) probable keywords grouped into categories:
Here we can see for which queries our Performance Max ads appeared and what the conversion value was for each query. This data can help us optimize our search campaigns.
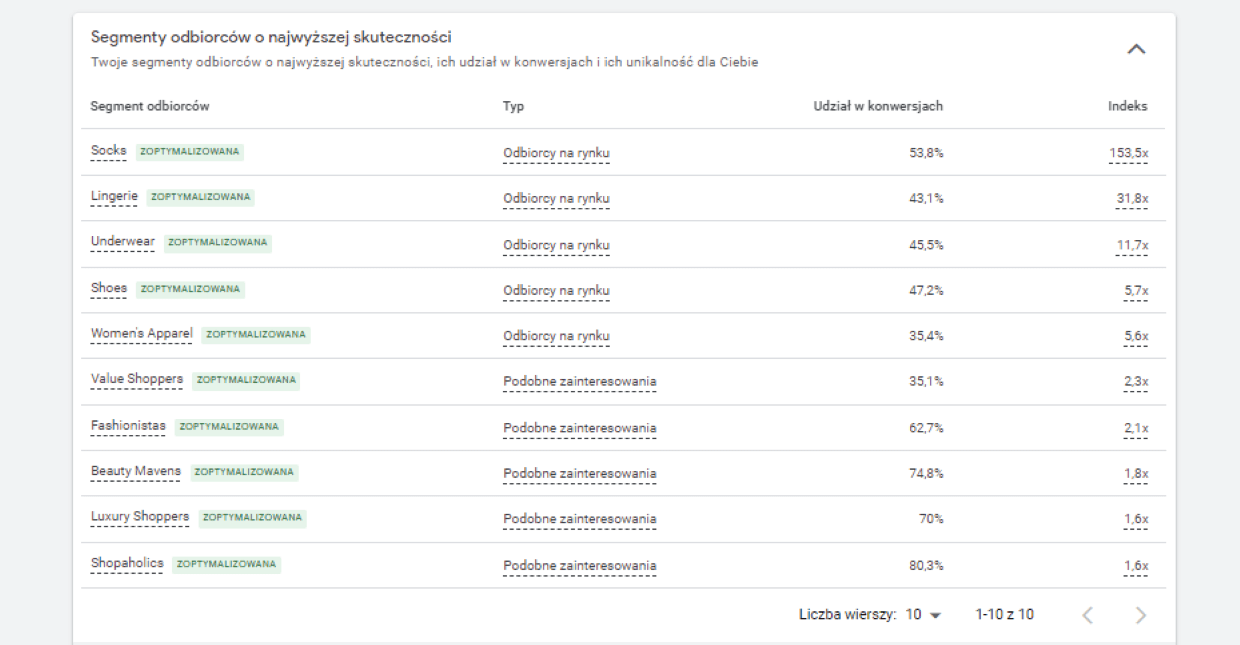
We can also check the data for individual customer segments with the highest efficiency.
What’s the deal with the location?
Another quite important point worth checking is the actual location of the user to whom we display ads. Unfortunately, also in this case, at the level of the campaign, we do not have the option to choose to exclude targeting according to the following options:
- Presence: people in excluded locations (recommended),
- Presence or interest: people who are currently in, regularly visit or are interested in locations that you have excluded.
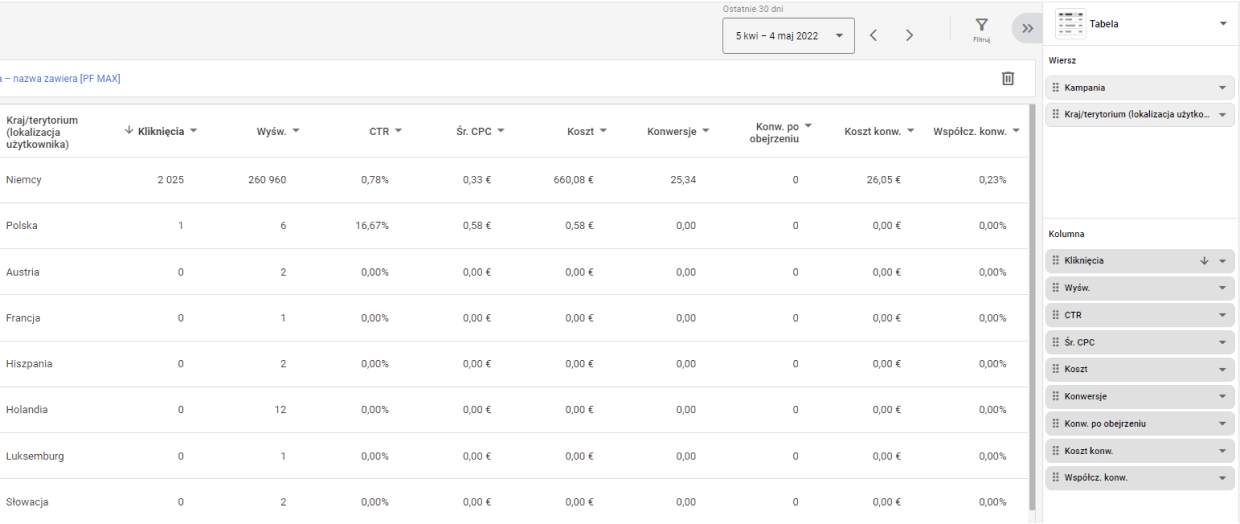
Luckily, we found a way! A custom location report for a user who viewed ads as part of the Performance Max campaign will allow us to review this data and possibly exclude unwanted locations.
To check your location report, go to your Google Ads account for custom reports and create a report with the Country/Territory column (user’s location).
As we will see in the indicated report, despite the campaign settings for the location of Germany, the campaign targeted advertising to users located in other locations.
In this case, to avoid this type of surprises, we can exclude unwanted locations at the level of the Performance Max campaign.
The reports, statistics and data indicated by us are not directly available at the level of the Performance Max campaign, but we can – in colloquial terms – “dig up” them by, for example, creating custom reports. Although a lot of data is not yet available to SEM specialists at the moment, the ability to create custom reports is a cure for the “the less you know, the better you sleep” policy. After all, the more SEM expert knows, the better!


